11 min to read
Inventory Optimization

Inventory Optimisation
Introduction
What is Uncertainty?
Making judgements with incomplete or unreliable information

Uncertainty in Supply Chain
- Demand Uncertainty (Will Customers Buy - As Forecasted)
- Supply Uncertainty (Supplier be on Time - For Delivery)
- Production Uncertainty (Enough Production Capacity - Production)
Managing a supply chain requires making judgements with incomplete or unknown information. Uncertainty in the supply chain can stem from a variety of factors, including demand uncertainty, supplier uncertainty, and production uncertainty. Addressing these difficulties necessitates striking the appropriate balance between service level, stock holding, and safety stock.
Demand Uncertainty : Demand uncertainty refers to the possibility of buyers not purchasing things as expected. This can be attributed to causes such as shifting consumer tastes, unanticipated events, and economic situations. When demand is uncertain, businesses must keep safety stock on hand to offset unforeseen variations. Demand uncertainty can be further divided into smooth and volatile demand. Smooth demand happens when the expected volume is similar to the actual demand, necessitating a lower safety stock to maintain the same service level. In contrast, fluctuating demand arises when the predicted volume differs significantly from the actual demand, necessitating a greater safety stock to maintain the same service level.
Supply Uncertainty : Supply uncertainty is the risk of suppliers failing to deliver items on time. This can be attributed to geopolitical events, last-minute orders, transportation delays, weather conditions, vehicle breakdowns, driver shortages, and trade obstacles. When suppliers are untrustworthy, businesses must keep greater safety stock to ensure that they can meet client demand in the event of unforeseen delays. Supplier reliability is another aspect that influences safety stock. When suppliers are dependable and deliver items on schedule, businesses can keep less safety stock. In contrast, when suppliers are unreliable and frequently deliver goods late, businesses must have a bigger reserve stock to ensure that they can meet client demand in the event of unexpected delays. Conversely, unreliable suppliers who frequently deliver goods late or in incorrect quantities force businesses to maintain larger reserves of safety stock. In such cases, businesses must account for potential disruptions in the supply chain by holding extra inventory to meet customer demand during periods of unexpected delays or shortages.
Production Uncertainty : Production uncertainty refers to the possibility of not having adequate capacity to meet demand. This could be due to raw material shortages, production flaws, maintenance, strikes, energy prices, labour shortages, and equipment malfunctions. When manufacturing is uncertain, businesses must keep additional safety stock to ensure that they can meet client demand in the event of an unforeseen shortfall.
Safety stock is also impacted by lead times. Shorter lead times allow businesses to keep less safety stock on hand. On the other hand, longer lead times require businesses to maintain higher levels of safety stock so they can guarantee meeting client demand in the event of unforeseen delays. In summary, striking the correct balance between service level, stock holding, and safety stock is essential for controlling uncertainty in the supply chain. This entails evaluating lead times, supplier and production reliability, demand volatility, and historical prediction inaccuracies. By doing this, businesses may reduce the risk of stockouts and maximise their inventory management while making sure they have adequate inventory on hand to fulfil client demand.

Stockouts
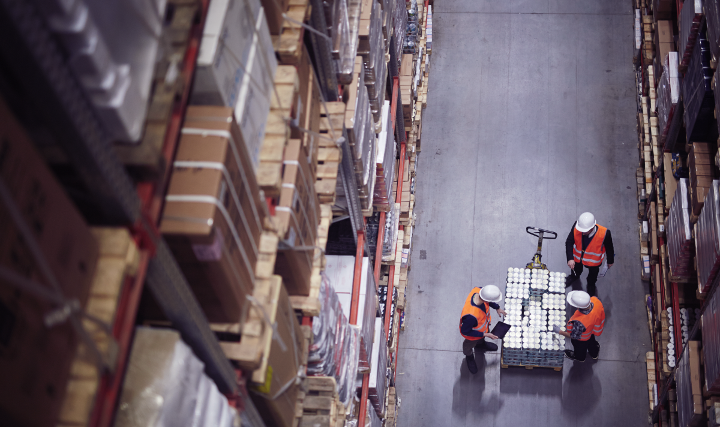
When a business runs out of a specific item that consumers are requesting, it is referred to as a stockout. Stockouts are viewed negatively in inventory management because they cause missed sales and disgruntled customers. Forecasting demand, controlling inventory levels, and making sure that stock is replenished on time to prevent stockouts are all essential components of effective inventory management.

Addressing These Challenges.
A Late Delivery from supplier causes Stockout for Days. (Safety Stock is additional stock as a buffer)
How much is needed?
What are the various stock levels?
1) Too Little: Understocked (stock outs)
2) Perfect: To optimise financial KPI (well-stocked), service level and stock keeping should be balanced.
3) Too Much: Excessive capital committed plus storage expenses (perishability is a greater issue) (Excessively stocked)
SKU Demand - Easy To Forecast / Difficult
SKU Delivery - on Time / Late
SKU Last - Forever / Short Shell Life
SKU Specific - Uncertainty with demand (High)
Demand Uncertainty
Smooth vs. Volatile (More Uncertainty - Greater Safety Stock Needed to Hold) Smooth: When the forecasted volume is close to the actual demand, holding a safety stock (SS) is required to achieve the same service level. Volatile: When the forecasted volume is often far from the actual demand, holding a greater safety stock (SS) is required to achieve the same service level.

Supply Uncertainty
On-Time Delivery vs Late Delivery (More Uncertainty Requires Greater Safety Stock) If a supplier is reliable and delivers on time, a small safety stock is needed. However, if a supplier is unreliable and delivers late, a large safety stock is necessary.
Production Uncertainty
Production Reliable (Clock Work) should be replaced with Small SS. Production Unreliable (Out of Action) should be replaced with Large SS.
Raw Material Shortage / Production Defects / Maintenance / Strikes / Energy Costs / Labour Shortage / Machine Breaks Down
Lead Times Uncertainty
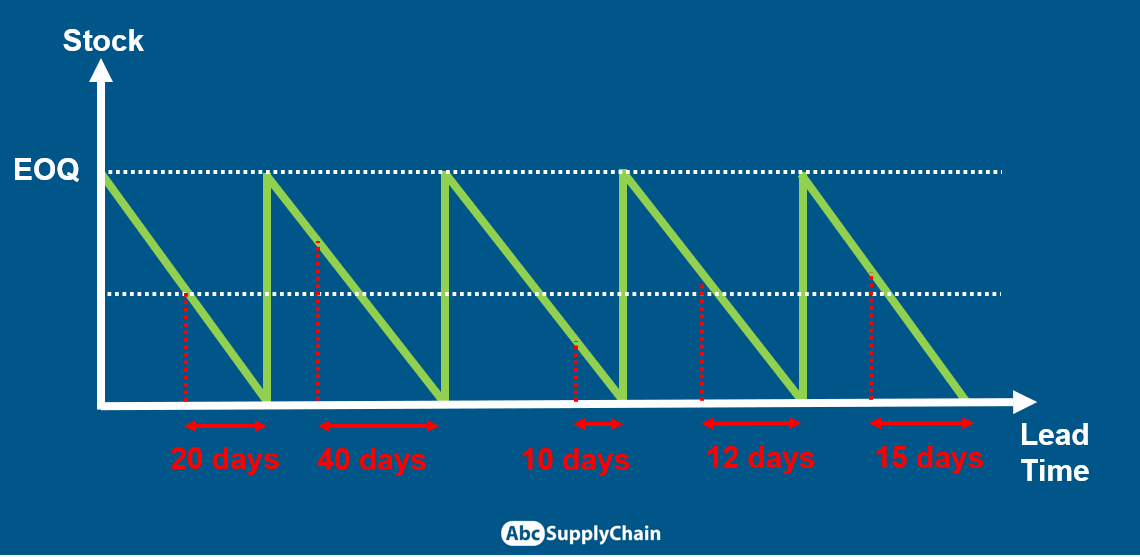
Review Period Frequency and Stock Holding When the review period of a supply chain is shorter, less stock needs to be held. Conversely, when the review period is longer, more stock needs to be held. Lead Time Comparisons Short lead time between the reorder date and delivery date results in a small safety stock (SS). In contrast, a long lead time between the reorder date and delivery date results in a large safety stock. Service Level Comparisons To cover against an increase of outlier events, increase the target service level (and therefore the safety stock) in the supply chain. This will impact each component in a distinct way.

Inventory Management (Safety Stock, ROP, Min Max Levels)

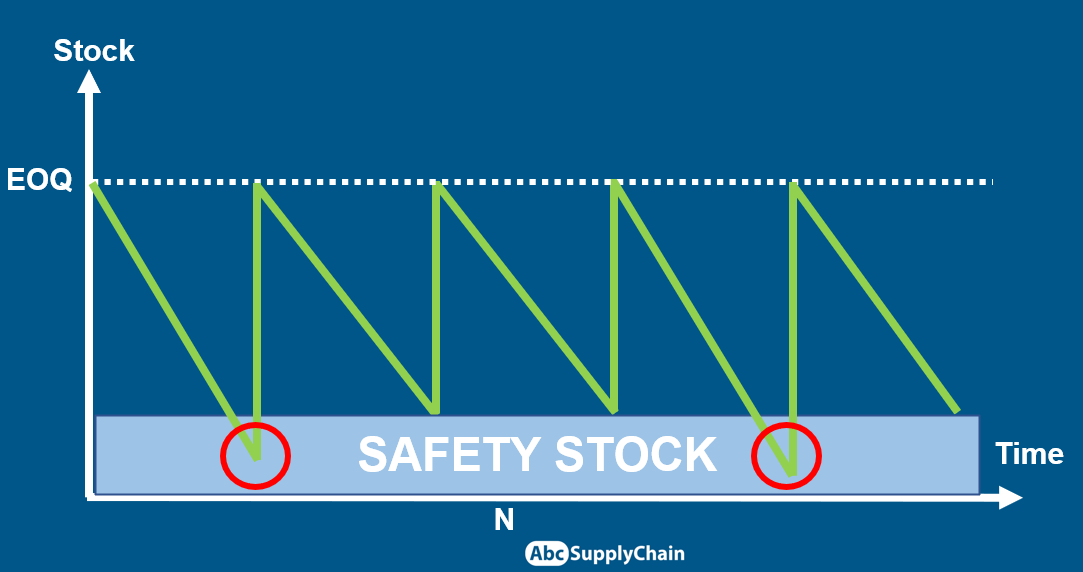
Safety Stock :
Safety stock is a quantity of inventory that a company holds to buffer against unexpected demand or supply chain disruptions. Calculating safety stock is an important aspect of inventory management, as it helps ensure that a company has enough inventory on hand to meet customer demand while minimizing the risk of stockouts.
Assuming the Forecast Error Distribution is a Normal Distribution then Safety Stock is calculated as follows :
There are various ways to calculate safety stock by using the historical forecast error / or demand data to estimate the variability of demand. If the forecast errors / demand is normally distributed, which is often assumed in inventory management, then the standard deviation of the forecast error / demand can be used to calculate the safety stock.

The following formulas can be used
- Average - Max Method :
Safety Stock = (lead_time_max * demand_max)-(lead_time_avg * demand_avg)
- Heizer and Render Method :
Safety Stock = z_score * demand_sd * sqrt(lead_time_avg)
- Greasley’s Method :
Safety Stock = z_score * demand_avg * lead_time_sd
- King’s Method :
Safety Stock = z_score * (sqrt(lead_time_avg*(demand_sd)**2 + ((demand_avg)**2 * (lead_time_sd**2))))
- Alternative Method :
Safety Stock = (z_score * demand_sd * sqrt(lead_time_avg))+ (z_score * demand_avg * lead_time_sd)
Here, z_score is computed as follows : (As the normal distribution is symmetric in nature we need to tweak the formula to account for both the tails.) z_score <- qnorm(service_level + ((1 - service_level) / 2))
z_score is the number of standard deviations required to achieve the desired service level.
qnorm or ppf : ** Probability Point Function**`(or Inverse Cumulative Distribution Function)
The graph on the left denotes that for a given x value the respective cdf(x) value is input to the ppf function, and ppf returns once again the original x value.
>>> import scipy.stats as st
>>> st.norm.ppf(.95)
1.6448536269514722
>>> st.norm.cdf(1.64)
0.94949741652589625
This formula calculates the stock level needed to maintain a certain service level. It multiplies the Z-score of the service level by the standard deviation of demand.
SKU Last and SKU Specific are two factors that increase demand uncertainty, and therefore require a higher safety stock. Additionally, increasing the target service level will also require a larger safety stock to cover against outlier events. When calculating the appropriate safety stock size, it’s important to consider historic forecast errors and the volatility of demand. This can be done by analyzing the forecast error distribution and using the KDE method to create a smooth curve, which is then converted into percentiles to determine the corresponding safety stock.

Assuming the Forecast Error Distribution is not Normally Distributed then Safety Stock is calculated as follows : (Real World Cases)
Non-parametric method
When forecast errors are not normally distributed, using the standard deviation to calculate safety stock may not be appropriate. In such cases, we can use a non-parametric method, such as kernel density estimation (KDE), to estimate the probability density function of the forecast errors and then use this distribution to calculate safety stock.
KDE is a method that estimates the probability density function of a random variable based on a set of observations. It works by placing a Kernel, which is a probability density function, at each observation and then summing the kernels to obtain an estimate of the underlying density function.
Parametric method
Assuming the Forecast Error Distribution is not Normally Distributed then Safety Stock is calculated as follows : (Real World Cases)
The GARCH (Generalized Autoregressive Conditional Heteroskedasticity) model is a popular time-series model used for estimating volatility and forecasting future values of a time series. It can also be used to estimate the standard deviation of forecast errors for safety stock calculation.
Note that the GARCH model is a more complex and computationally intensive method compared to the other methods, but it can provide more accurate estimates of the standard deviation of forecast errors, especially for non-normally distributed data.

Reorder Point
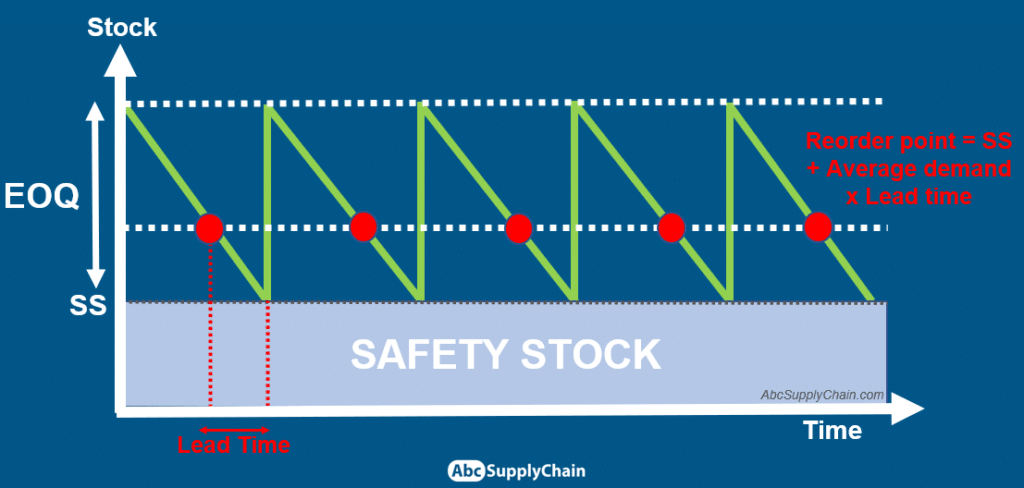
ROP = Average Demand + Safety Stock
ROP stands for Reorder Point, and it is the inventory level at which an order needs to be placed to avoid a stockout. The Safety Stock is added to the average demand to determine the ROP. The Safety Stock acts as a buffer against demand and supply uncertainties, ensuring that there is enough inventory to meet customer demand in case of unexpected fluctuations. A higher Safety Stock will result in a higher ROP, which means that orders will need to be placed more frequently to maintain inventory levels.
Min Max Levels
If your stock drops below this point then you need to reorder more so you’re not at risk of stocking out.
Min Level = ROP
Max Level is the order up to amount. Order enough stock so that you’ll have enough net stock
Max Level = Forecast Demand in Review Period + Min Level
Safety stocks aren’t an absolute protection against stockouts. A safety stock is always a balance between the risk and impact of a stockout and the cost of the extra safety stock inventory.The service level captures this balance. The service level is the percentage of the demand quantity you will be able to honor from your inventory.
For critical items, you want to be more than 99.x% sure you have them on stock when a demand comes in.
For a less critical items, you can can accept a stockout risk that is be considerably higher. Either the customer will wait during a temporary stockout, either you accept missing a small part of sales.
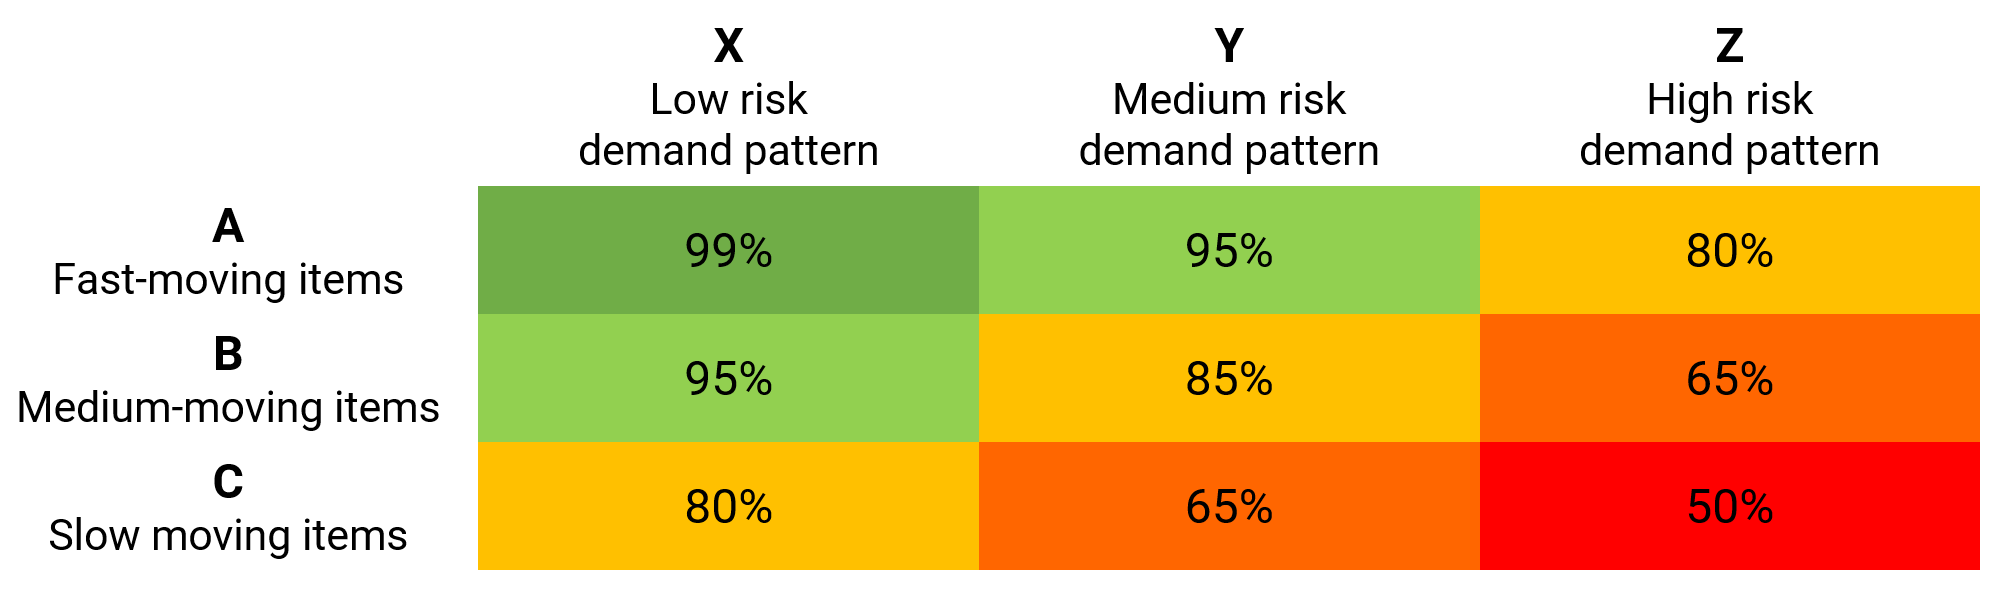
A ABC or ABC-XYZ analysis of your products is very common to choose an appropriate service level. The picture below shows an example of such a matrix. The matrix varies greatly by industry and company: a supermarket will operate with a completely different set of rules and objects than a spare parts warehouse or a industrial equipment manufacturer.

Comments